Scientific Reports Publishes a New Article Regarding Intensified Springtime Deep Convection over the South China Sea and the Philippine Sea Drying Southern China
Source: Institute of Earth Climate and Environment System & School of Atmospheric Sciences
Written by: Institute of Earth Climate and Environment System & School of Atmospheric Sciences
Edited by: Wang Dongmei
An article with a new perspective on “
Intensified Springtime Deep Convection over the South China Sea and the Philippine Sea Dries Southern China” by the research group of Prof. Song Yang from Sun Yat-sen University was just published in
Scientific Reports.
Scientific Reports is an open access journal that publishes high-quality research from all areas of the natural sciences.
Springtime rainfall, accounting for 25-40% of the annual rainfall in southern China, exerts great agricultural and socioeconomic impacts on the region. In the recent decades, southern China has experienced a significant declining trend of precipitation in boreal spring (Fig. 1). Meanwhile, precipitation has increased over the South China Sea and the Philippine Sea (SCS-PhS).
This paper presents observational and modeling evidences suggesting that the intensified latent heating released by the convection over SCS-PhS leads to suppressed springtime rainfall over southern China (Fig. 2a-b). Moisture budget analysis indicates that the drying trend over southern China is due mainly to weakened convergence of moisture flux, which is controlled by a heat-induced anomalous overturning circulation reinforced by the convection over SCS-PhS (Fig. 2c-d). Further idealized simulations support that the heat-induced overturning circulation and its corresponding anomalous cyclone can be well established in several days under the spring mean flow condition (Fig. 3). Thus, this rapid dynamic process is associated with both the intraseasonal-to-interannual variations and the long-term change of the springtime rainfall over southern China.
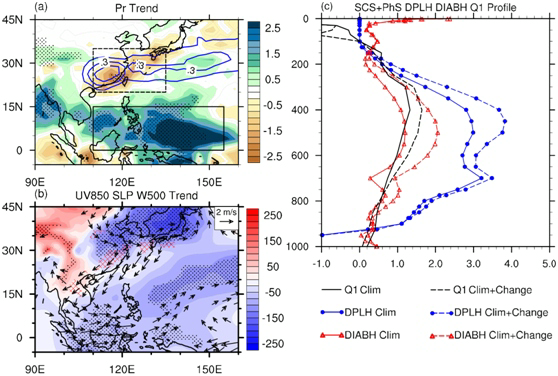
Figure 1: (a) Shading areas show the linear trend of MAM precipitation for 1979-2013. Blue contours show the areas where the ratio of climatological MAM precipitation to climatological annual precipitation exceeds 25%. (b) Shading and dotted areas are the same as (a), but for sea level pressure. Vectors denote the linear trend of 850-hPa wind and hatching indicates where the linear trend of 500-hPa vertical velocity is above 0.025 [Pa s-1 (35yr)-1]. (c) MAM climatology, and climatology plus 35-yr linear change, of heating profile averaged over the lower box in (a).
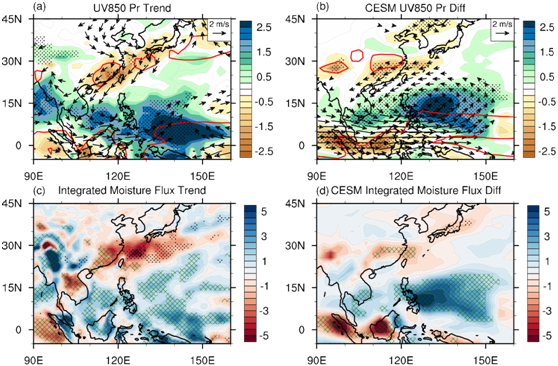
Figure 2: (a) Shading areas show the linear trend of MAM precipitation. Vectors denote the linear trend of 850-hPa wind. Red contours show the position of the rain-belts. (b) Same as (a), but for CESM simulated differences between the HEAT_CP run and the CTRL_CP run. (c) Shading areas show the linear trend of CVIMF. Green hatching denotes where the convergence term takes up more than 50% of CVIMF change, and the advection term taking up more than 50% of CVIMF change is marked by black dots. (d) The same as (c) but for CESM simulated differences between the HEAT_CP run and the CTRL_CP run.
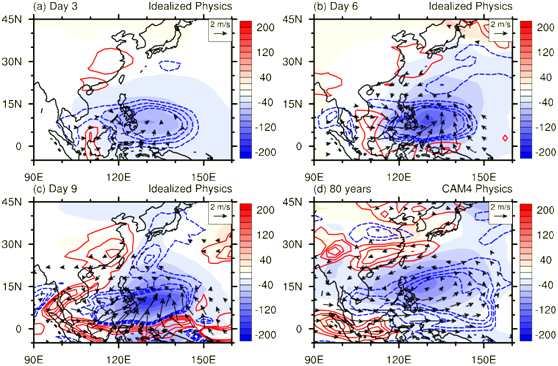
Figure 3: (a-c) Three different snapshots: differences of day 3, day 6, and day 9 between the HEAT_IDEAL run and the CTRL_IDEAL run in the CAM dynamical core integration with idealized physics. (d) 80-year mean differences between the HEAT_CP run and the CTRL_CP run in the coupled climate model CESM with CAM4 full physics packages.
This study was financially supported by the National Key Research Program of China (Grants 2014CB953900 and 2012CB956002), the National Natural Science Foundation of China (Grant 41375081), the Jiangsu Collaborative Innovation Center for Climate Change, China, and the Zhuhai Joint Innovative Center for Climate, Environment and Ecosystem, China. Computing resource for the CESM was provided by the high-performance grid computing platform of Sun Yat-sen University and the “Tianhe-2” in the National Supercomputer Centre in Guangzhou.